CloudWatch Log Events
Jets supports CloudWatch Log Events. This allows you to have a Lambda function run when your CloudWatch Log Group receives log data. You can access the data via event and log_event.
Example
Generate code.
jets generate:event log --trigger log --method report
It looks something like this.
app/events/log_event.rb
class LogEvent < ApplicationEvent
  log_event "/aws/lambda/hello"
  def report
    puts "event #{JSON.dump(event)}"
    puts "log_event #{JSON.dump(log_event)}"
  end
end
Here’s where the logs subscription filter is in the CloudWatch console:

The log_event declaration creates an AWS::Logs::SubscriptionFilter. So you can provide a filter pattern like so:
class LogEvent < ApplicationEvent
  log_event("my-log-group",
    filter_pattern: "{$.userIdentity.type = Root}"
  )
  def report
    puts "event JSON.dump(event)"
  end
end
It is recommended that you use a filter_pattern because there can be a lot of CloudWatch Log event data. Here are the docs on Searching and Filtering Log Data. You can do regular text filter if your logs are plain text and JSON-path based filtering if your logs are JSON.
Tailing Logs
It helps to tail the logs and watch the event as it comes through.
jets logs -f -n log_event-report
Send Event
To get an event to send, invoke the Lambda function it’s listening to. In this case:
aws lambda invoke --function-name hello output.txt
Event Payloads
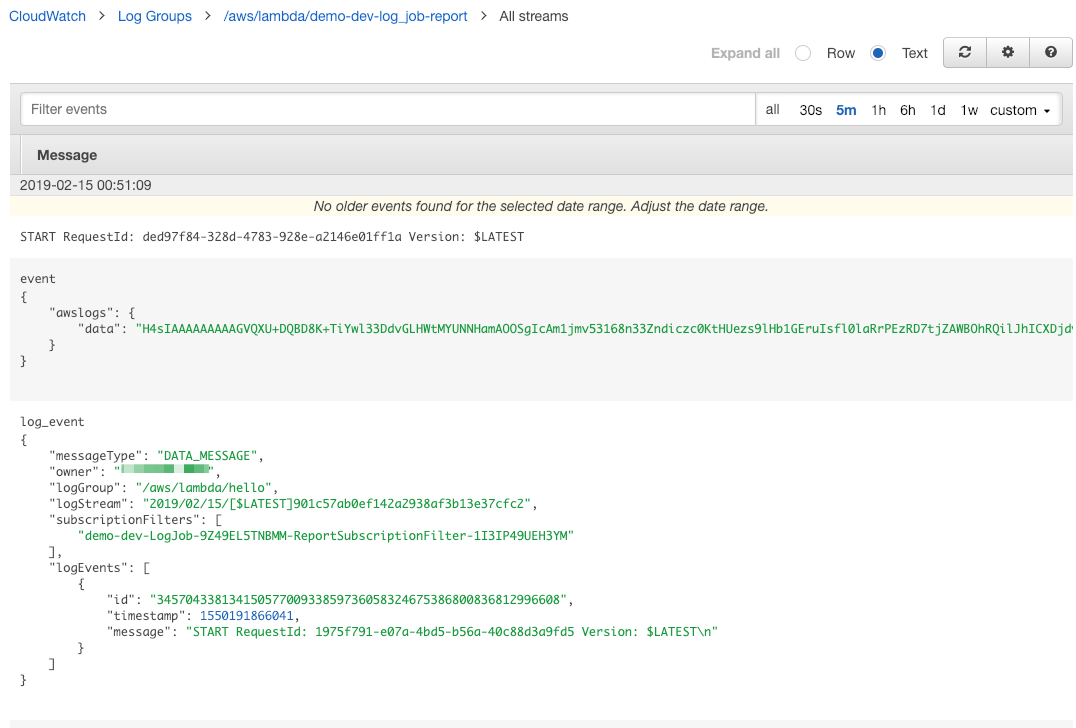
The event payload from CloudWatch Log is a compressed base64 encoded String within a JSON structure. That’s quite a mouthful, so an example helps explain:
event
{
    "awslogs": {
        "data": "H4sIAGPuZFwAA61SXY/SQBT9K83ER2pn7nzzVkJdVwEN7WYftsRM6YCNLcW2gEj4705xN2yiJms083Jzzsy55565J1TZtjVrmxy3Fg3ROEzCT9MojsObCA1QfdjYxsGEAFDKGOdCOLis1zdNvds6JjCHNihNleUm+GzLsv5Jx11jTeV4wEQHGALCgodXkzCJ4mRBLcYYhMkwFWy5IgYruTKgNNF5JlbaSbS7rF02xbYr6s2bouxs06LhA8ptVfu53fuTev2uznx+f/8ez2AKah76c7utmy7+5aWfjKaT8I7g2W3yFi0u/qK93XS95AkVubNJGRdKcglSUCw0BayIdEdJLbFkkmJGGFZUc0LdRAyUFFzoPoyucBF2pnJpEM4xIaJXInLwFK2TvyTjHeqmzNMNOg/+rat8YVfbD+mdUvTFHkmKhinam3JnXTm4YHDF4AmjV8yV59+71UpLygFzJRQWRIEW3LGcSQWOUFoDEPedgoCQ7E9uhVTP3UazsTe3X3fu4m0+9NiSaMUw9YnRzGcgM1/nyvqMG8BLt1YA5j+44y90N48+fpgnf22wG+8a06/i0COSvpbUq9q0GxVlaXPvygHGjvDSbuoWvDl6cfHduhegvOnIgeab90jctda15vyC9+Mvzj8ACHlavMMDAAA="
    }
}
To get the data out we must first decode64 it, ungzip it, and load the JSON string.
log_event
Jets provides the uncompressed data via log_event:
{"messageType"=>"DATA_MESSAGE",
 "owner"=>"112233445566",
 "logGroup"=>"/aws/lambda/hello",
 "logStream"=>"2019/02/14/[$LATEST]3e00026ab0364cf1a087fa28919db6f9",
 "subscriptionFilters"=>
  ["demo-dev-LogEvent-5WWK0N2M28RA-ReportSubscriptionFilter-TBMLAU10NITH"],
 "logEvents"=>
  [{"id"=>"34568757276306932081717187970747304140839513019428765696",
    "timestamp"=>1550116687517,
    "message"=>"hello world\n"},
   {"id"=>"34568757276306932081717187970747304140839513019428765697",
    "timestamp"=>1550116687517,
    "message"=>
     "event {\"key1\":\"value1\",\"key2\":\"value2\",\"key3\":\"value3\"}\n"},
   {"id"=>"34568757279897352058680618296534554782735899221891612674",
    "timestamp"=>1550116687678,
    "message"=>"END RequestId: 4c198403-1a94-427b-9d8e-45a20c20122a\n"},
   {"id"=>"34568757279897352058680618296534554782735899221891612675",
    "timestamp"=>1550116687678,
    "message"=>
     "REPORT RequestId: 4c198403-1a94-427b-9d8e-45a20c20122a\tDuration: 173.73 ms\tBilled Duration: 200 ms \tMemory Size: 128 MB\tMax Memory Used: 55 MB\t\n"}]}
Here’s a screenshot of CloudWatch logs to show an example of this data:

